
Announcing Evan’s Awesome A/B Tools
By Evan Miller
May 13, 2013
If you’ve ever needed to do basic statistical calculations for an A/B test, your options traditionally have been:
Use a dedicated statistical package from the ’80s
Find a Java applet or JavaScript calculator and relive the ’90s
Find the appropriate equations on Wikipedia and fire up Excel
None of these options are very intuitive, as they all just spit out numbers without providing much in the way of context. (“What’s a t-statistic again?”)
Today I am happy to announce a new suite of online statistics calculators, which I am hereby christening Evan’s Awesome A/B Tools. I am calling these tools awesome because they are intuitive, visual, and easy-to-use. Unlike other online statistical calculators you’ve probably seen, they’ll help you understand what’s going on “under the hood” of common statistical tests, and by providing ample visual context, they make it easy for you to explain p-values and confidence intervals to your boss. (And they’re free!)
These tools assume some background in statistics; as great as they are, I’m afraid they’re not a substitute for learning. But, if at one point in your life you knew the difference between a significance level and null hypothesis, I think you’re going to love them.
So without further ado, I give you…
Evan’s Awesome Sample Size Calculator
I get emails quite frequently asking me to interpret the equations in my article How Not To Run an A/B Test. Well now there’s a web page that will interpret it for you:
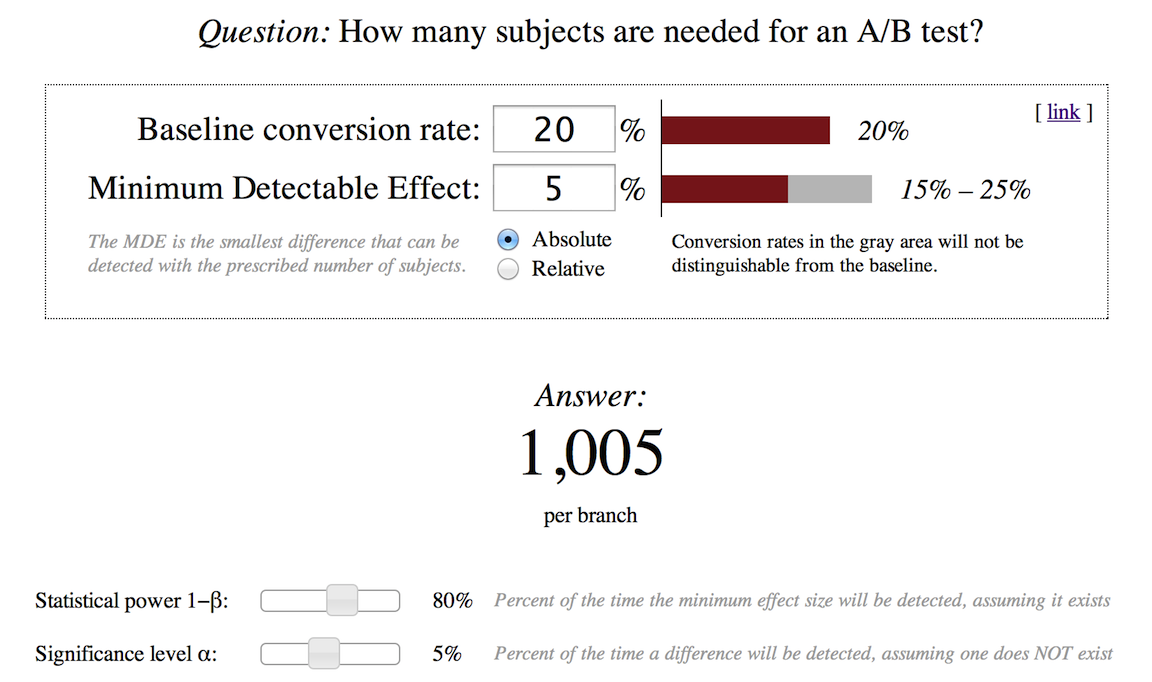
Punch in the expected conversion rate and the smallest difference you want to detect, and voila! A big fat number tells you how many subjects you’ll need in each branch of the experiment. Sliders let you adjust the desired power and significance levels; the answer updates automatically as you move the sliders, so you can intuitively get a feel for how the statistical power affects the scale of the experiment.
Then of course you’re going to need…
Evan’s Awesome Chi-Squared Test
So you’ve finished running your A/B test and it’s time to interpret the results. That’s where the chi-squared test comes in handy:
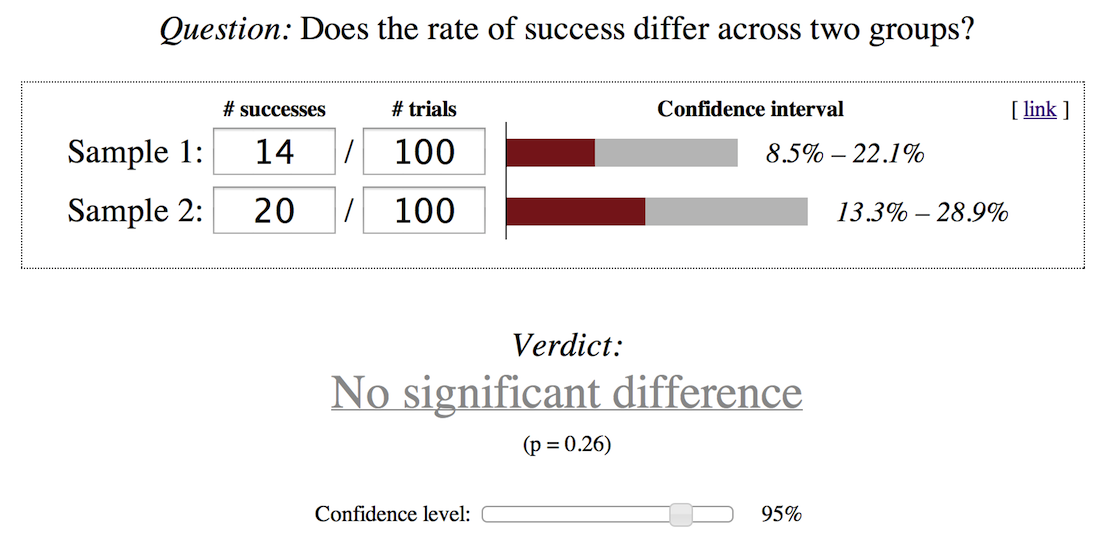
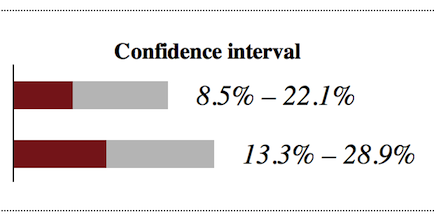
Key in the number of conversions and the number of trials in each branch, and presto! You’ll instantly see the confidence intervals around the success rate in each group, and by manipulating the confidence slider, you can watch the intervals grow and shrink accordingly.
Below the bar chart, you’ll get the result of a chi-squared test telling you whether or not there’s a statistically significant difference between the two success rates. Couldn’t be easier.
That is, unless you’re talking about…
Evan’s Awesome Two-Sample T-Test
If you’re measuring a continuous outcome such as time spent or money saved, a chi-squared test won’t help you. The two-sample t-test comes to the rescue:
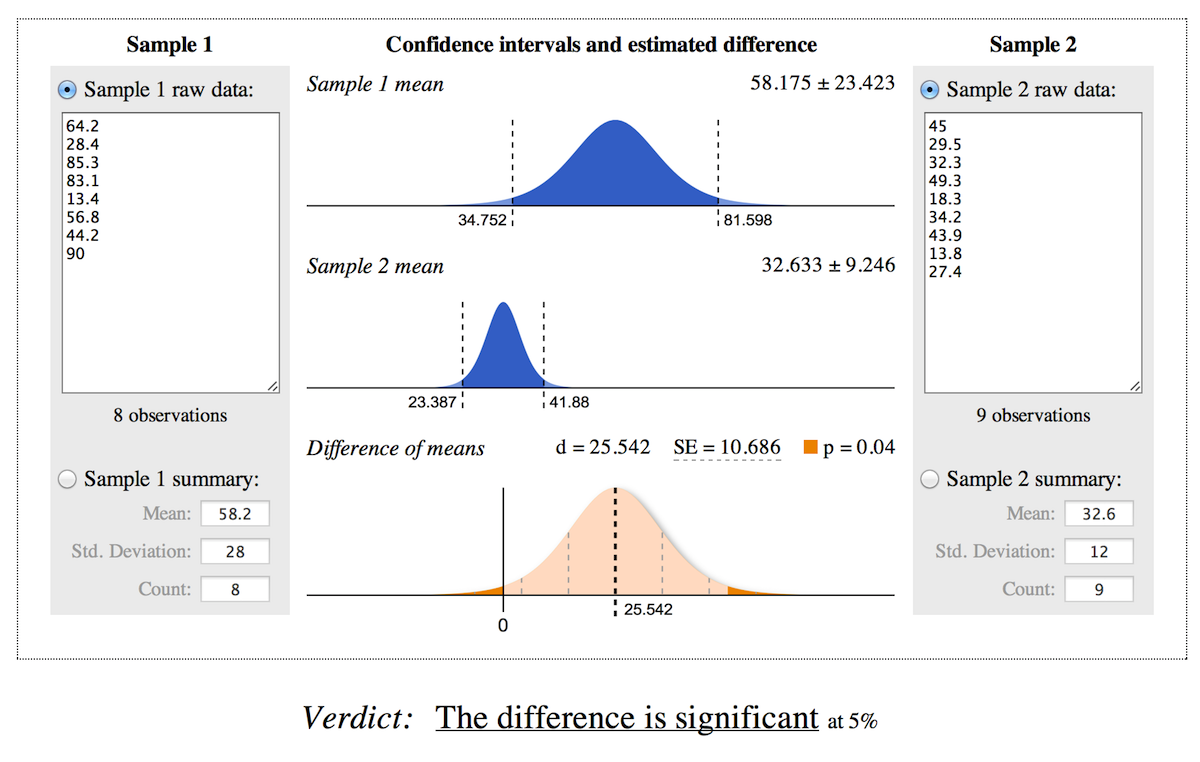
This interface is a bit more involved than the other two, but it’s packed with power:
Visual confidence intervals. The displayed t-distribution lets you see and predict the relationship between the confidence level and the confidence interval around the mean of each sample. That’s because the fraction of the area between the two dashed lines is equal to the confidence level. Neat, huh?
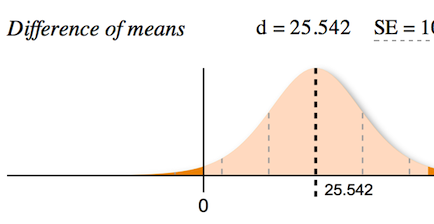
Visual hypothesis tester. When most people think of hypothesis tests, they think of looking at big tables of numbers or a p-value in isolation. But with Evan’s Awesome Two-Sample T-Test, you get an intuitive picture that shows you the relationship between the estimated difference d, the null hypothesis, and the p-value. (The p-value is really just an area under a curve, and with this tool, you’ll see the actual curve rather than just a textbook illustration.) The visual hypothesis tester helps you see whether the mean difference between two samples is statistically significant, practically significant, or both.
Manual data input. Ok, this feature is actually pretty boring, but I just wanted to point out that you can type or paste data into a text box, or just enter the summary statistics (mean, count, and standard deviation).
What are you waiting for?
Check ’em out! Enjoy the awesomeness for yourself and send the link to your A/B testing friends!
 Sample Size Calculator |
 Chi-Squared Test |
 Two-Sample T-Test |
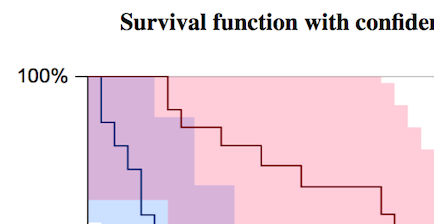 Survival Curves Test |
As always, if you encounter a bug or have a suggestion, just send me an email.
You’re reading evanmiller.org, a random collection of math, tech, and musings. If you liked this you might also enjoy:
Get new articles as they’re published, via LinkedIn, Twitter, or RSS.
Want to look for statistical patterns in your MySQL, PostgreSQL, or SQLite database? My desktop statistics software Wizard can help you analyze more data in less time and communicate discoveries visually without spending days struggling with pointless command syntax. Check it out!

Back to Evan Miller’s home page – Subscribe to RSS – LinkedIn – Twitter