
Fixing a Hole in the F-Distribution
By Evan Miller
May 2, 2013
The current version of Wizard has a tiny, almost imperceptible bug in one of its graphics. Can you spot it?
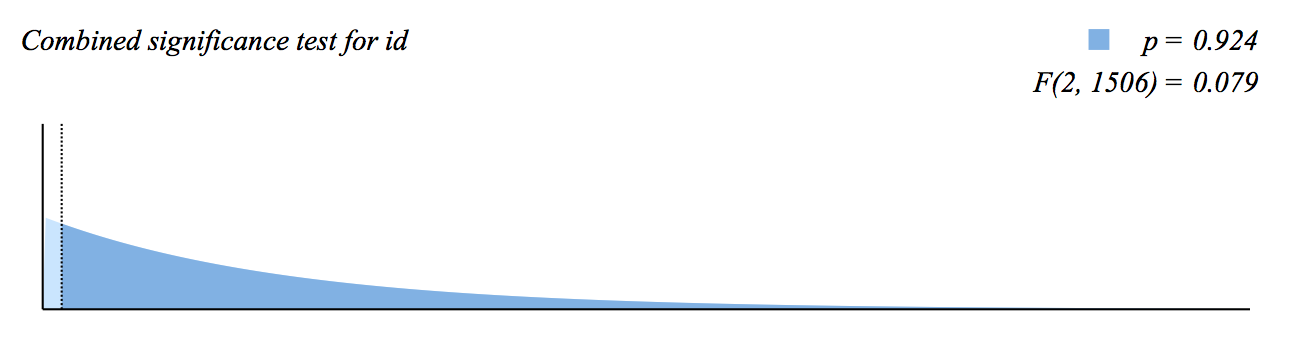
The above is an F-distribution, which is used to test for the combined statistical significance of multiple coefficients. The dark blue area under the curve represents the p-value of the test. (Here, a test statistic of 0.079 — represented by the dotted line on the left — yields a p-value of 0.924 — highly insignificant!)
The overall shape of the F-distribution — with the advertised 2 and 1506 degrees of freedom — is correct. But there’s a slight problem with the implementation.
Here, I’ll show you exactly where the bug is:
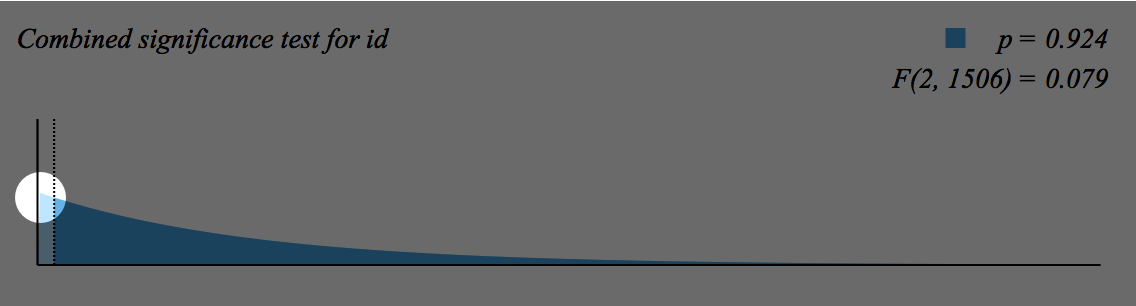
Still don’t see it? Let’s zoom in to the circled area:

How about now? Here, I’ll highlight the problem:

As it happens there’s a tiny gap between the light blue fill and the Y-axis. As you might guess from the zoomed-out view, and as we’ll see from the equations in a minute, the fill and the axis ought to run flush.
When I first noticed this problem, I thought it would be a run-of-the-mill off-by-one error. As it turned out, the problem was a bit more subtle, with a small but general lesson in numerical computing. Perhaps you’ll enjoy it!
The problem
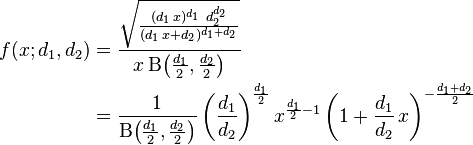
An F-distribution has two degrees of freedom; together they define the shape of the distribution:
Here’s an interactive version of the same equation (requires Wolfram CDF Player) (sorry):
Here’s the C code that Wizard uses to draw the F-distribution given df1 and df2:
1    CGContextBeginPath(ctx);
2    CGContextMoveToPoint(ctx, 0.0, 0.0);
3    for (i=0; i<200; i++) {
4        CGFloat x = 0.0125 + 0.025 * i;
5        CGFloat y = exp(-logBeta
6             + 0.5 * df1 * log(1.0 * df1 / df2)
7             + (0.5 * df1 - 1) * log(x)
8             - 0.5 * (df1 + df2) * log(1 + x * df1 / df2)
9        );
10       CGContextAddLineToPoint(ctx, x, y);
11   }
12   CGContextClosePath(ctx);
The code looks innocent enough, evaluating the F-distribution at 200 points, but there’s a problem. In line 2, it starts at \((0, 0)\), and immediately moves to \(x = 0.0125\) in line 4 and evaluates \(f(x)\) in line 5.
That is, the code draws the first line from \((0, 0)\) to \((0.0125, f(0.0125))\). The trouble is that it really should be drawing the first line from \((0, f(0))\) to \((0.0125, f(0.0125))\). In other words, the code assumes that \(f(0) = 0\).
But, you might object, since \(f(x)\) is always proportional to \(x^{d_1/2 - 1}\), and zero raised to any power is zero, the assumption that \(f(0) = 0\) seems like a safe one — right?
Wrong! Zero raised to zero is one (not zero!), so in the special case when \(d_1 = 2\), the first \(x\) term becomes \(x^0 = 1\) and leaves the rest of the equation intact. The equation then reduces to:
\[ f(0; d_1=2, d_2) = \frac{2}{d_2 B(1, \frac{d_2}{2})} = 1 \](To see why this always equals one, check out the Wikipedia page on the beta function.)
If you have the Wolfram CDF Player installed, you can examine the behavior of \(f(0)\) for various values of \(d_1\) by using the first slider in the demo above. You’ll quickly see that \(f(0) = 1\) when \(d_1 = 2\), but \(f(0) = 0\) everywhere else.
The gap, in short, appears because the code’s author (me) made a bad mathematical assumption that works “almost always”, but fails utterly in a very common case.
Although the bug should now be obvious to the reader, the solution is not.
The fix
We could just start \(x\) at zero, instead of at \(0.0125\) as in the above code. But! Because the above code works with logs, the call to log(x) in line 7 will fail when \(x = 0\). Thus the easy and obvious solution will not work “out of the box”.
Now you might be wondering why, instead of implementing the equation for \(f(x)\) directly, the code evaluates \(e^{\log(f(x))}\). Wouldn’t it be simpler to get rid of the log(x) entirely and implement the equation as it appears on the Wikipedia page? Surely we can fix this bug by simplifying the code and making it more general?
We could, but then we’d have a much worse problem. Raising x to large positive and negative powers will overflow the computer’s double-precision floating point representation in fairly short order. Let’s look at that equation again:
Because IEEE-754 numbers can “only” represent numbers as large as about \(10^{300}\) and as small as about \(10^{-300}\), and since \(x\) ranges from \(0.0125\) to \(5\) in this code, raising \(x\) to a power of just a few hundred will start causing overflows and underflows and result in a dreaded NaN.
By working with logs, the very large and very small numbers that result from raising \(x\) to various powers end up canceling each other out, and the computer never has to store or work with the unrepresentable intermediate values. Getting rid of logs to make the code more general would actually make the code more fragile.
So to fix the problem, rather than generalizing the code to work with \(x = 0\), we’ll leave the core code alone and instead add a clause to handle the special case when \(d_1 = 2\) and \(x = 0\). The following change should do the trick:
     CGContextBeginPath(ctx);
     CGContextMoveToPoint(ctx, 0.0, 0.0);
+    if (df1 == 2) {
+        CGContextAddLineToPoint(ctx, 0.0, 1.0);
+    }
     for (int i=0; i>200; i++) {
         CGFloat x = 0.0125 + 0.025 * i;
         CGFloat y = exp(-logBeta
             + 0.5 * df1 * log(1.0 * df1 / df2)
             + (0.5 * df1 - 1) * log(x)
             - 0.5 * (df1 + df2) * log(1 + x * df1 / df2));
         CGContextAddLineToPoint(ctx, x, y);
     }
     CGContextClosePath(ctx);
And lo and behold… the hole is fixed!

Conclusion
It can be tempting to rewrite code that mishandles a special case to be more “general”. When fixing this bug, my first instinct was to rip out the log(x) and rewrite the code to conform exactly to the equation, which would (I thought) enhance both correctness and clarity. That instinct is generally a good one when writing code that operates on discrete entities with provable properties (sets, objects, etc.), but in the messy world of real numbers, it can completely upend carefully crafted numerical code.
So to fix the hole in the F-distribution, the correct solution was to make the code less abstract by adding a special case. It’s not pretty — but it works beautifully!
You’re reading evanmiller.org, a random collection of math, tech, and musings. If you liked this you might also enjoy:
Get new articles as they’re published, via LinkedIn, Twitter, or RSS.
Want to look for statistical patterns in your MySQL, PostgreSQL, or SQLite database? My desktop statistics software Wizard can help you analyze more data in less time and communicate discoveries visually without spending days struggling with pointless command syntax. Check it out!

Back to Evan Miller’s home page – Subscribe to RSS – LinkedIn – Twitter