
Rank Hotness With Newton’s Law of Cooling
By Evan Miller
February 15, 2009
Greg A. writes,
I enjoyed your post on how to not sort by average rating. I was wondering if you have any experience with sorting based on average votes over time to get a hotness rating.
Greg, I assume you mean “hotness” in the Reddit sense rather than the HotOrNot sense.

Fig. 1: what Greg is talking about |
Fig. 2: not what Greg is talking about |
Neither concept of hotness is defined with any rigor, but I imagine a “what’s hot” list should show what items, discussions, or products have gotten a lot of recent activity. I’m not going to analyze all the hotness algorithms out there, just my favorite.
I recommend a technique called exponential decay. Exponential decay has three components:
Each new item has an initial “temperature” reflecting its hotness
The temperature is increased by a fixed amount every time someone gives the item a thumbs-up
The temperature gradually drops down over time
A hot list then sorts items by temperature. As we’ll see, exponential decay is great because:
It’s easy to understand
It goes easy on the database
It can work without modification as your site gets more popular
First let’s talk more about the mechanics of exponential decay. Bumping up an item’s temperature in response to new activity is the easy part; but how do you figure out how much it has cooled? You first need to decide on a cooling rate, that is, how many hours it should take for the temperature T to fall by roughly half. With that in hand, you calculate:
(The exp function means take Euler’s number e=2.71828… to a power.)
The nice thing about this method is that you only need to write to the database when you’re incrementing the temperature. The rest of the time, for example when you’re sorting a list of items to display, you can calculate every item’s current temperature just based on its last reading, no matter how many hours ago. That is, you don’t need to constantly update the database, and you never need to process the rating history!
If you play with the decay parameters a bit, you should be able to show the right mix of new and hot items at the top of your list. With a small initial temperature, you’ll see fewer brand-new items; with a smaller decay rate, popular items will tend to linger longer.
Graphically, here’s how the temperature will drop over time. The shape of the curve is always the same for exponential decay; the parameters only determine the scale of the axes.
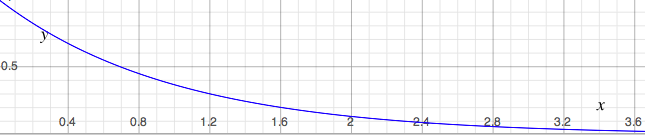
The choice of parameters is ultimately be a judgment call (or not; ask me sometime about A/B testing). As your site gets more popular, you may want to tweak the parameters, but the same parameters should work fine over a large range of site activity (i.e., no matter whether the top item has a temperature of 10 degrees or 10,000 degrees). Because the decay is exponential rather than quadratic or linear, even extremely popular items won’t get “stuck” at the top for too long after their popularity has peaked.
So in a nutshell, you will:
Pick an initial temperature for new items
Pick a cooling rate
Pick a temperature increment
When there is new activity on an item, calculate the current temperature, then increment and record it along with the current time
Sort items based on the current temperature using the formula above
And voila, you’ve got yourself a “hot” list. Another good use of this algorithm would be listing active discussion threads in an online forum (where each reply increases the temperature).
One last note about exponential decay: besides being easy to compute, it’s also the law that governs how any hot item cools down, from a hot brick to a hot tamale. It’s called Newton’s Law of Cooling.
REFERENCES
Newton’s Law of Cooling (Wikipedia)
You’re reading evanmiller.org, a random collection of math, tech, and musings. If you liked this you might also enjoy:
Get new articles as they’re published, via LinkedIn, Twitter, or RSS.
Want to look for statistical patterns in your MySQL, PostgreSQL, or SQLite database? My desktop statistics software Wizard can help you analyze more data in less time and communicate discoveries visually without spending days struggling with pointless command syntax. Check it out!

Back to Evan Miller’s home page – Subscribe to RSS – LinkedIn – Twitter