
A/B Testing Duration Data
By Evan Miller
August 25, 2013
Let’s say you make a change to your website and want to test whether people tend to stay on the site longer after the change.
You might think: that’s easy! I’ll just compare the average visit lengths before and after the change and then I’ll have my answer.
Readers of this blog are, of course, savvier than that; they know they should perform a proper statistical test to determine if a reported difference could be due to chance.
But there’s a problem. When comparing two continuous quantities (such as visit durations), the usual statistical test is the two sample t-test. A t-test requires three key pieces of information from each test group: the number of subjects, the sample mean, and the standard deviation.
Unfortunately, many reporting tools only report the mean and count; the standard deviation is apparently an ugly duckling that no one wants to talk about. For example, here’s a screenshot from a Google Analytics dashboard:
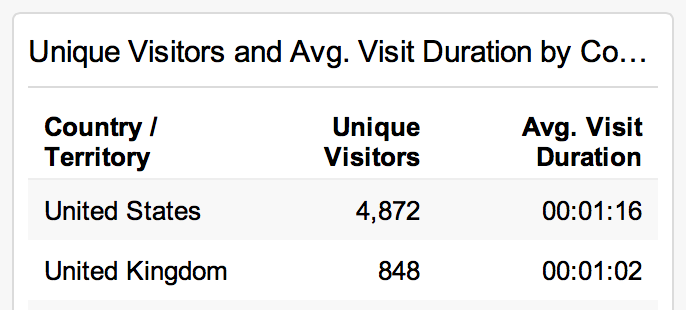
It’s a shame that the standard deviation has been left out here, because it renders a proper t-test impossible.
But that shouldn’t stop you from applying some math to the problem. With a simple and fairly reasonable assumption, you can arrive at an answer to report to the Big Boss.
Here’s the assumption: the probability of a visitor leaving the site at any given moment is constant.
It’s not a perfect assumption, as perhaps you have advertising copy with a few extremely engaging passages that no one would ever leave while reading. But it’s not a bad place to start.
That one assumption — sometimes called memorylessness — implies that the lengths of visits will follow an exponential distribution.
The nifty part about the exponential distribution is that its variance is always equal to the square of its mean. That means to perform a two-sample t-test, you just take the standard deviation to be the same as the mean. So if one group stays on the site an average of 62 seconds, you can take 62 seconds to be the standard deviation as well.
As an example, I’ve plugged in the numbers from that Google Analytics page here. (It quickly becomes clear that Americans spend more time on the example site than their British counterparts.)
Because the Big Boss might not understand the finer points exponential distributions, I’ve also created a dedicated Survival Times Tool. Type in the number of visitors in each group, and the average length of visit, and it will tell whether either group is sticking around longer in a statistically significant way. The tool also constructs confidence intervals around the mean for your viewing pleasure.
Of course, this tool shouldn’t stop you from telling your in-house programmers to please report the standard deviation whenever they report an average. An assumption can go a long way, but it’s never a good substitute for data.
You’re reading evanmiller.org, a random collection of math, tech, and musings. If you liked this you might also enjoy:
Get new articles as they’re published, via LinkedIn, Twitter, or RSS.
Want to look for statistical patterns in your MySQL, PostgreSQL, or SQLite database? My desktop statistics software Wizard can help you analyze more data in less time and communicate discoveries visually without spending days struggling with pointless command syntax. Check it out!

Back to Evan Miller’s home page – Subscribe to RSS – LinkedIn – Twitter